Measure co-movement
Daily log returns produce 3,916 pairwise correlations. A rank-based Kendall check confirms the pattern is not driven by a few extreme days.
An empirical market map
A map of the Hong Kong stock market drawn from what companies actually do together, rather than the sectors someone assigned to them.
89 companies · 10 groups · 3 years of daily returns
Every marker is a Hang Seng Index company. Color strength shows how reliably it belongs to its group.
Open full atlas ↗The premise
Sector labels tell you what a company is. Correlation tells you what the market believes it is exposed to.
Financial data providers put every stock in a box: HSBC is a bank, JD Health is healthcare, Sun Hung Kai is real estate. Those labels are useful, but they are still classifications. Prices offer a different account. When two stocks rise and fall together day after day, the market is revealing a shared risk—even when their labels disagree.
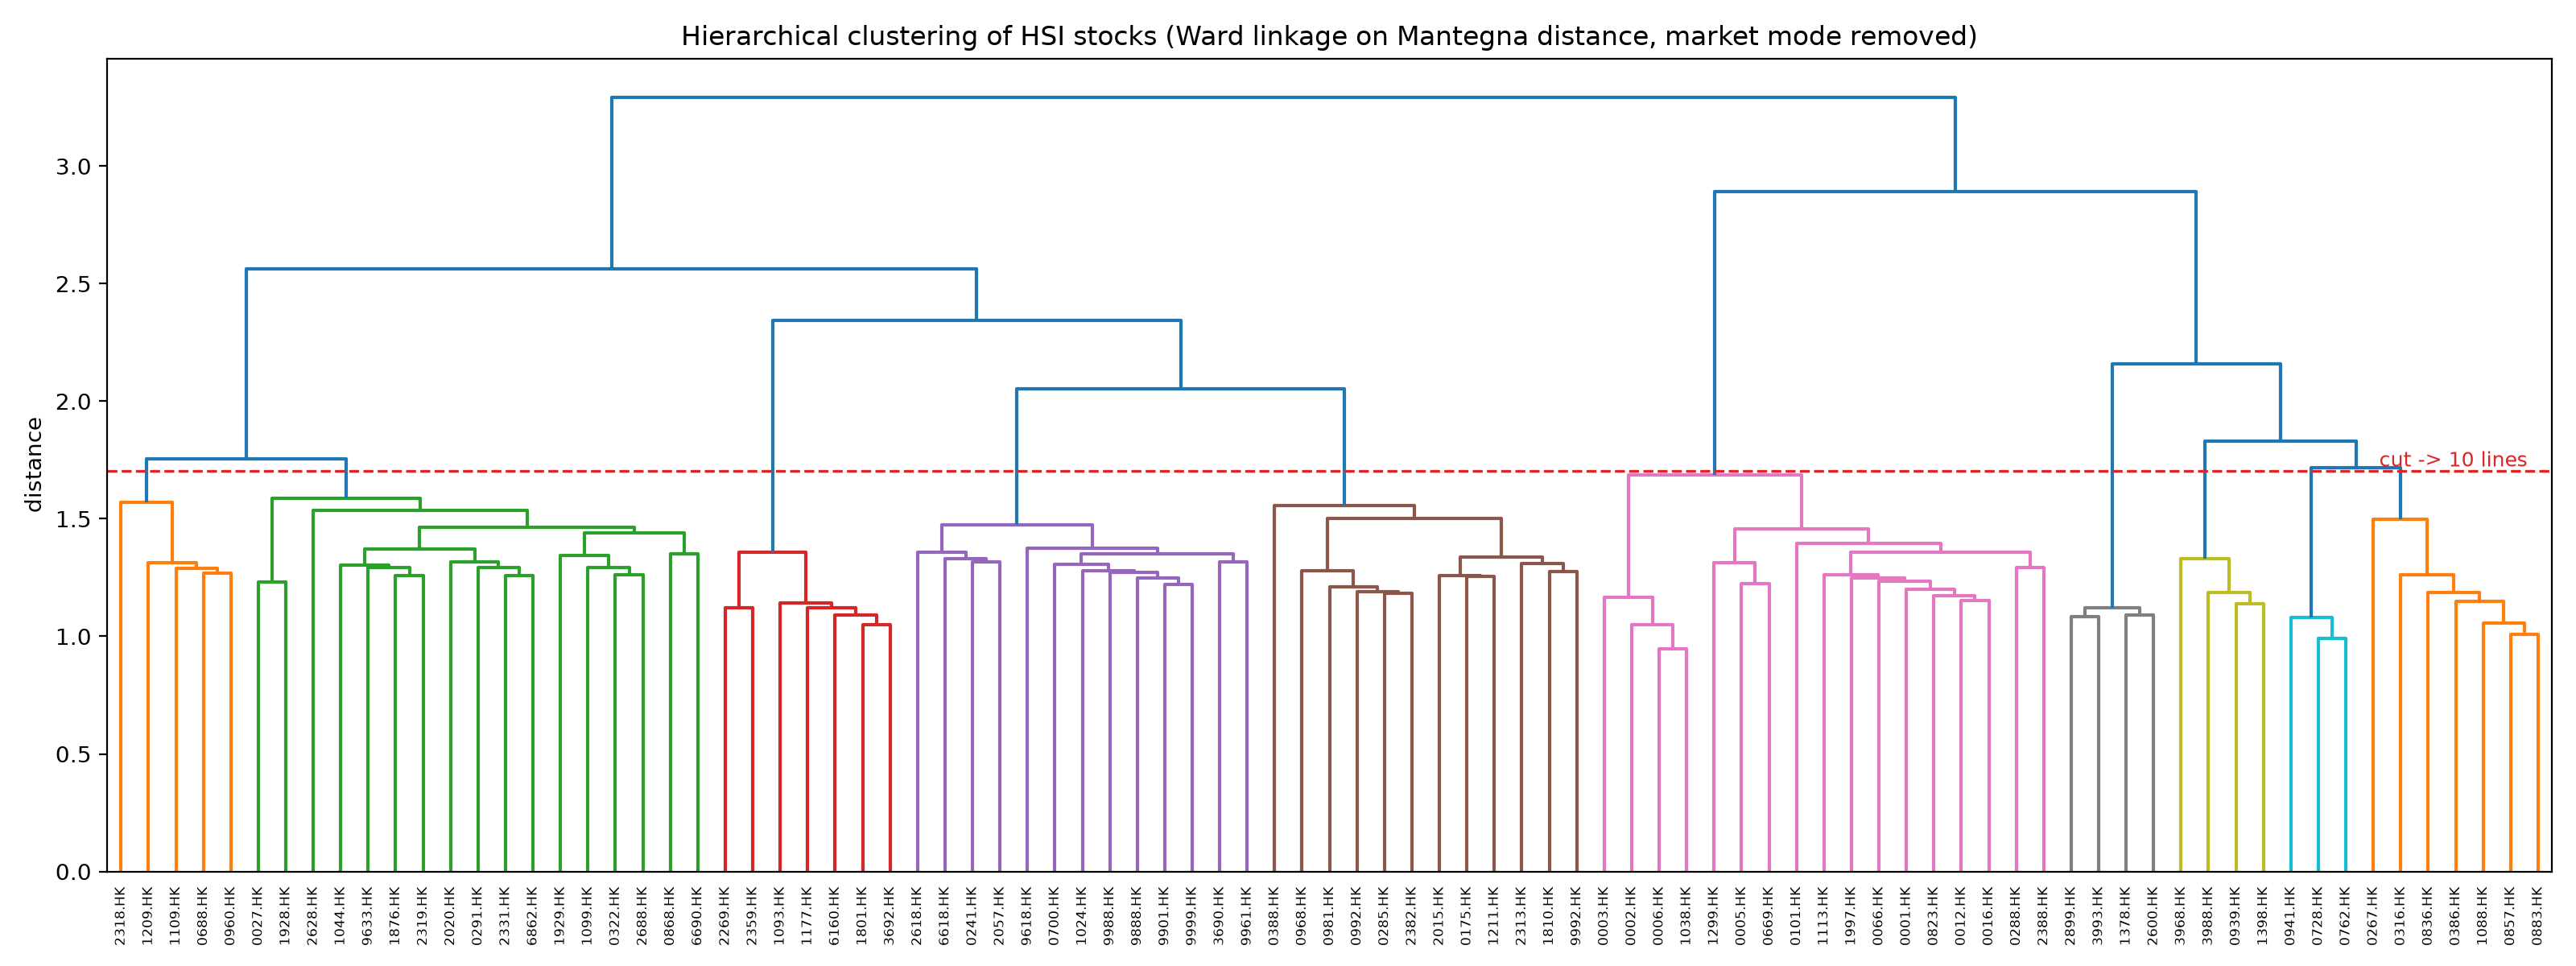
This atlas starts with three years of daily returns for 89 Hang Seng Index members. It removes relationships that look like sampling noise, keeps the strongest remaining links, and lets groups emerge without sector information. The most revealing companies are not at the center of a familiar group, but at the boundary between several.
The map is interesting precisely where the market’s grouping contradicts the official one.
From returns to structure
A correlation network can look persuasive even when it is mostly random. The method is designed to earn the picture before drawing it.
Daily log returns produce 3,916 pairwise correlations. A rank-based Kendall check confirms the pattern is not driven by a few extreme days.
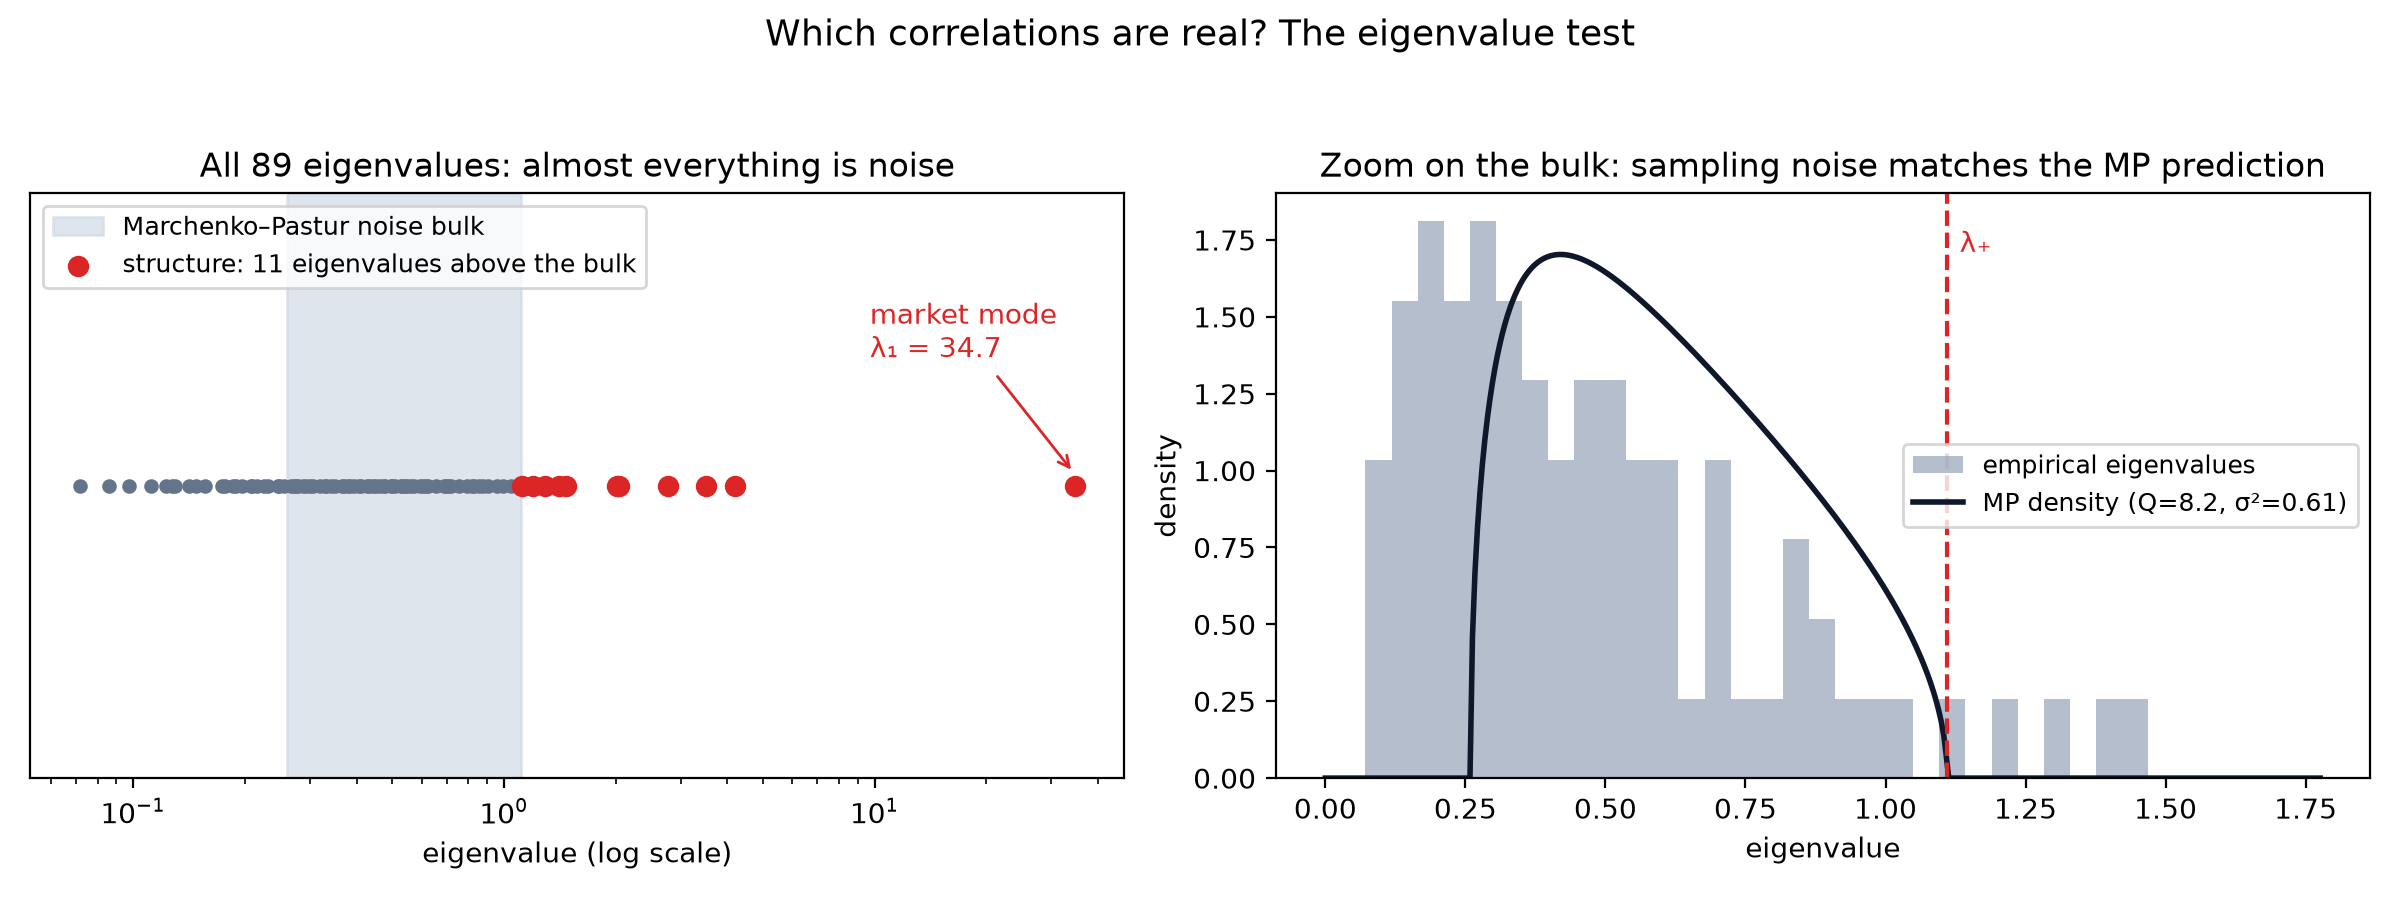
Random Matrix Theory identifies the eigenvalue range expected from unrelated data. Modes inside that range are compressed; only structure stronger than chance survives.
The leading mode explains 39% of total variance. It is retained for the network, but removed before clustering so the common market wave does not erase the group structure.
A minimum spanning tree selects 88 links that connect all 89 companies. A planar extension adds the most important loops without turning the map into a hairball.
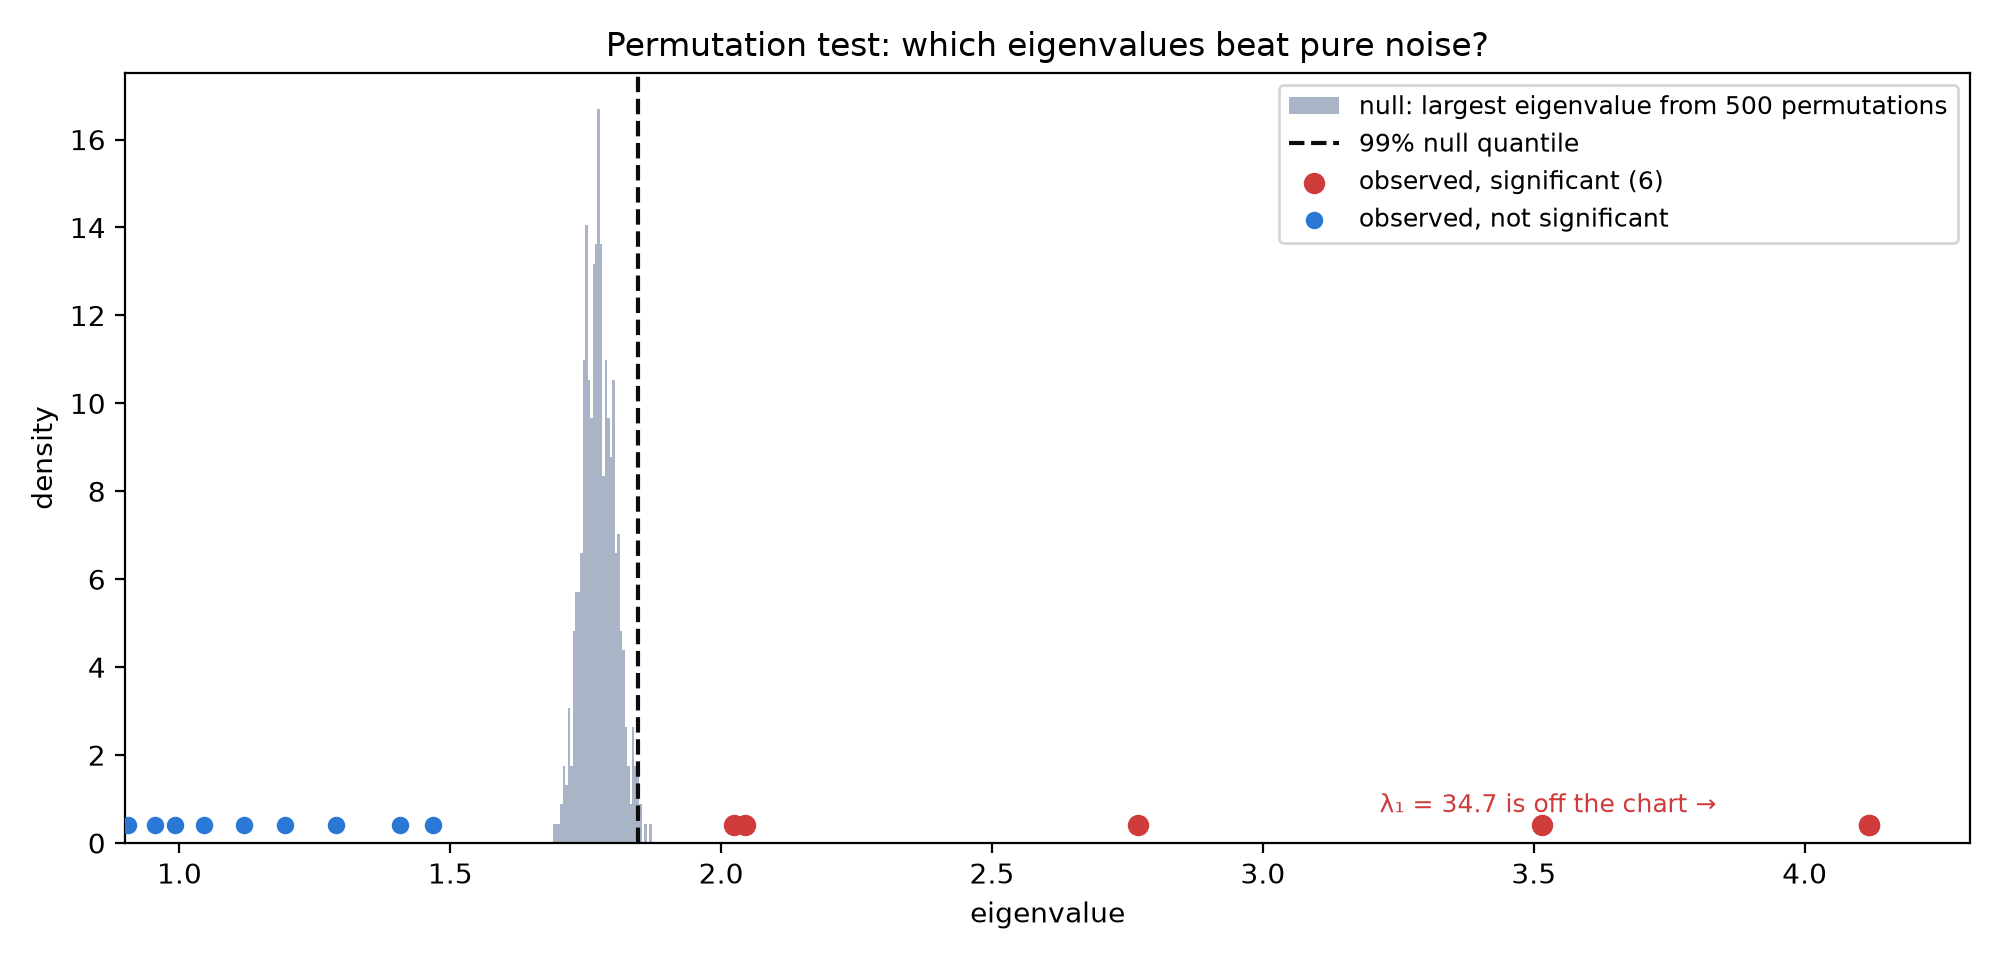
A permutation test asks which factors beat pure chance. A 200-run block bootstrap then grades each company’s group loyalty—the confidence encoded by marker saturation.
The return spread
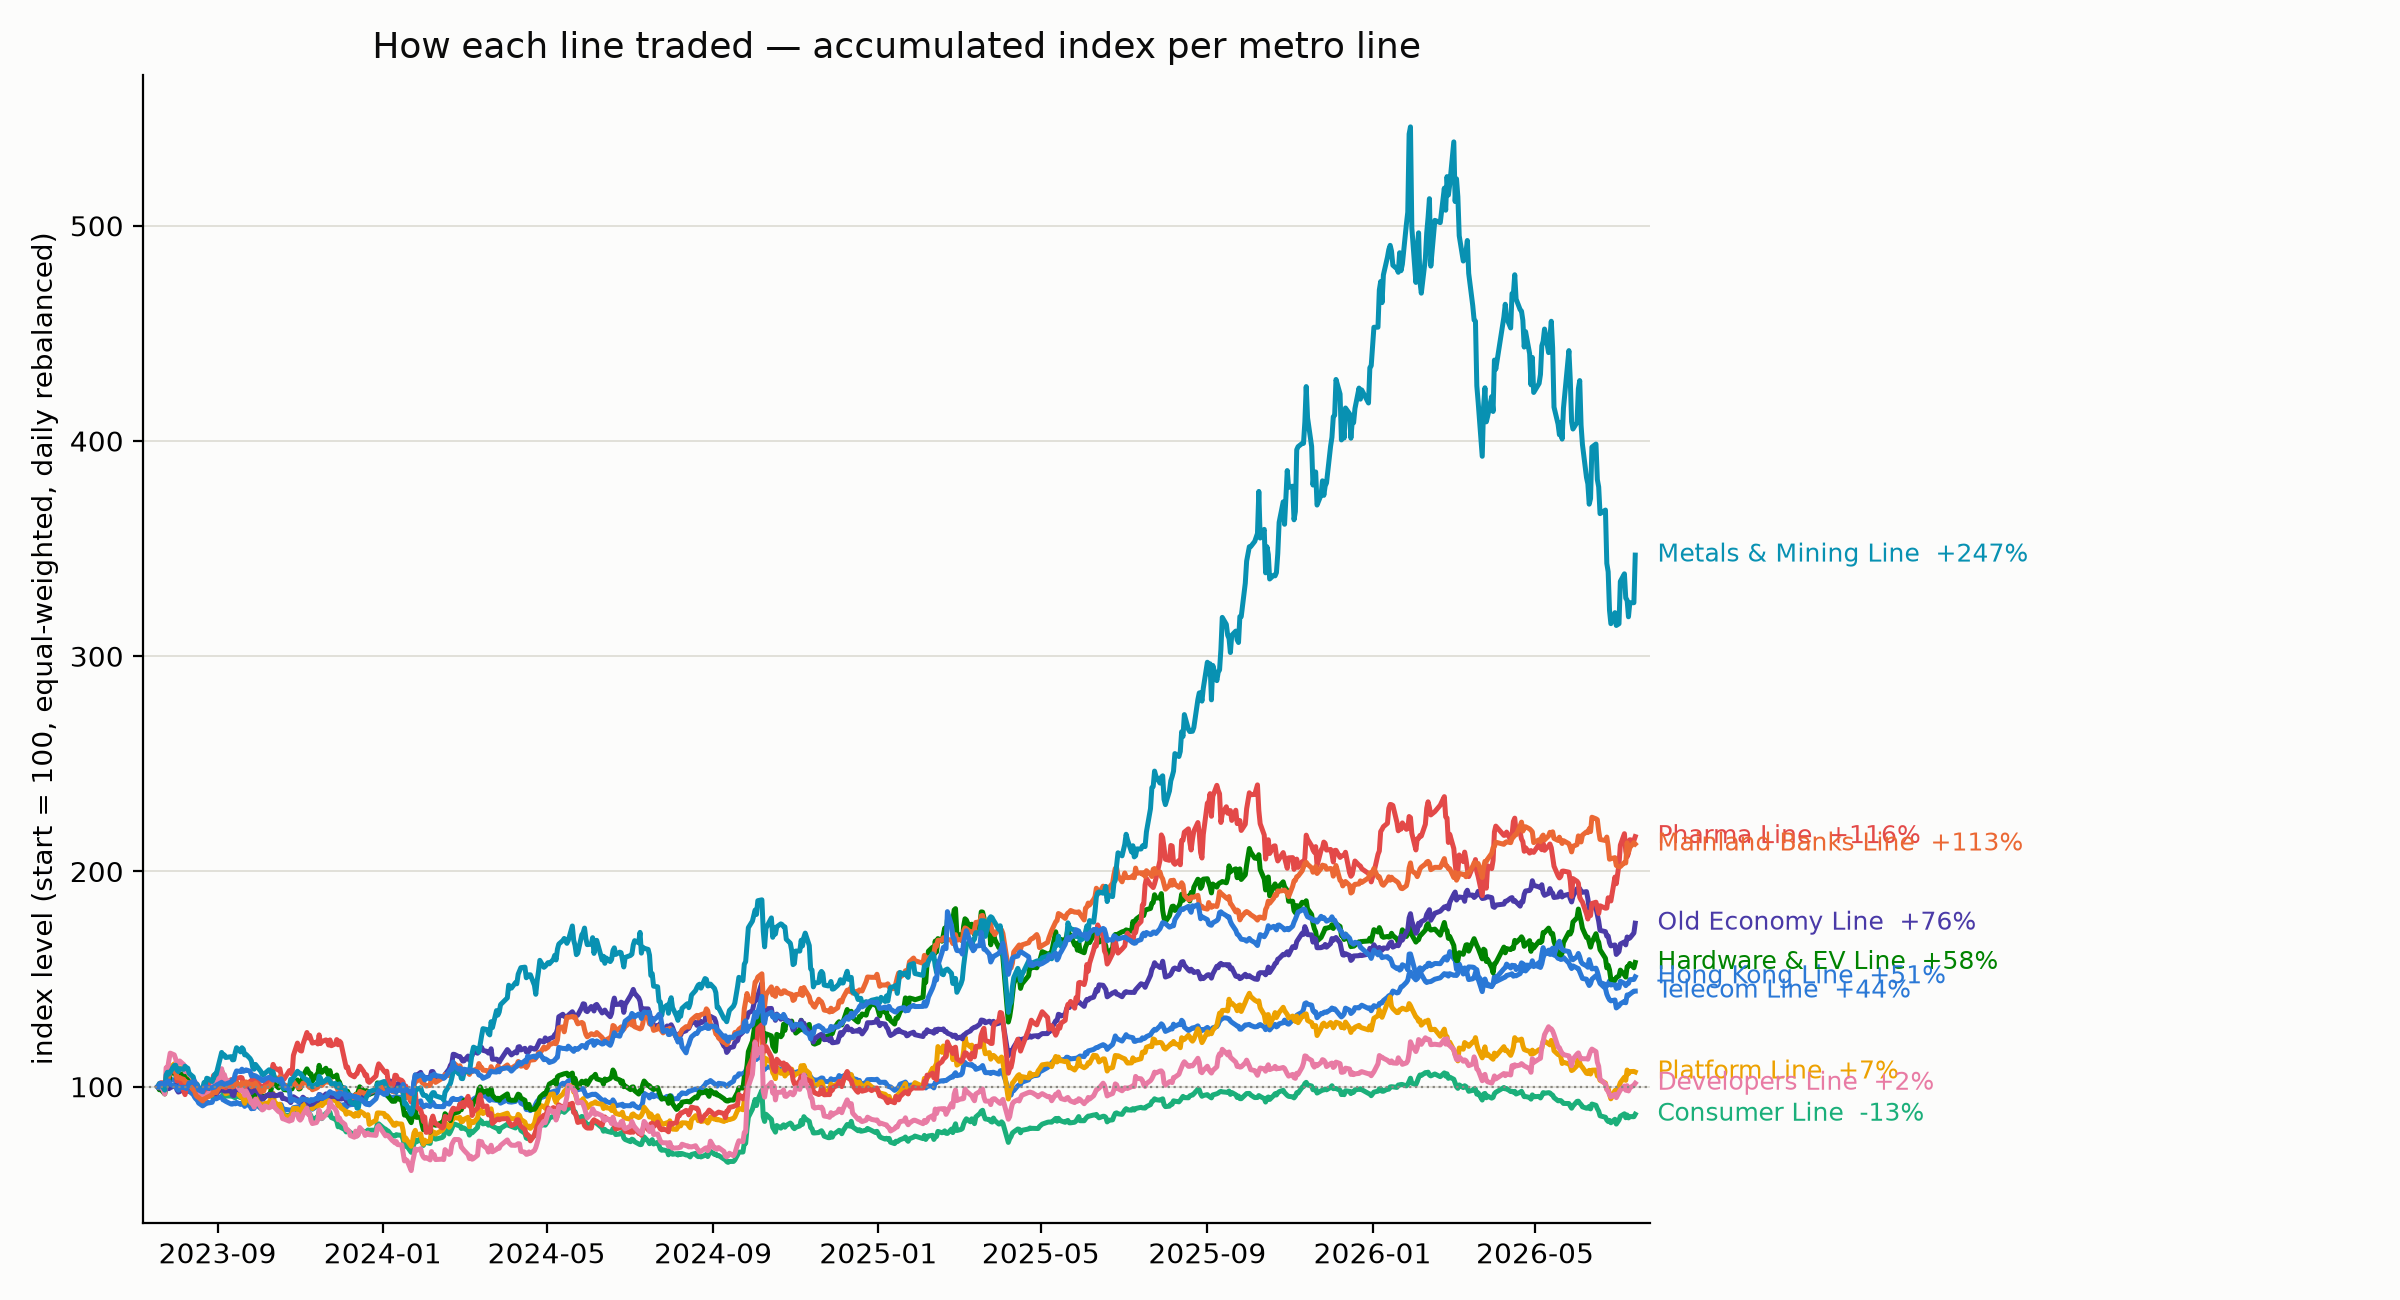
If the groups capture distinct exposures, their equal-weighted portfolios should take distinct journeys. They do.
Each group becomes a synthetic portfolio: equal money in every member, rebalanced daily, and rebased to 100. Over the same three-year window, Metals & Mining returned 247%, Pharma 116%, and the state banks 113%. Consumer lost 13%; Developers ended almost where they began. These are not official Hang Seng subindices—they are empirical portfolios created from the clustering.
The useful disagreements
The atlas does not replace sector classifications. It reveals the exposures those labels leave out.
The mainland state banks form a perfectly repeatable group. HSBC and AIA instead move with CK Hutchison, MTR and Hong Kong landlords. Local conditions and global rates matter more here than the word “bank”.
Mainland developers sit apart from Hong Kong landlords. The first group expresses the China property cycle; the second is tied more closely to Hong Kong rates, utilities and retail rents.
JD Health and Alibaba Health sit on the China Digital Line with their parent platforms, far from the WuXi pair and other drugmakers. Ownership and investor flow outweigh the filing category.
Its Old Economy membership survives only 18% of bootstrap reconstructions. A diversified conglomerate does not belong neatly to one exposure, so the atlas shows it with the palest marker.
A changing system
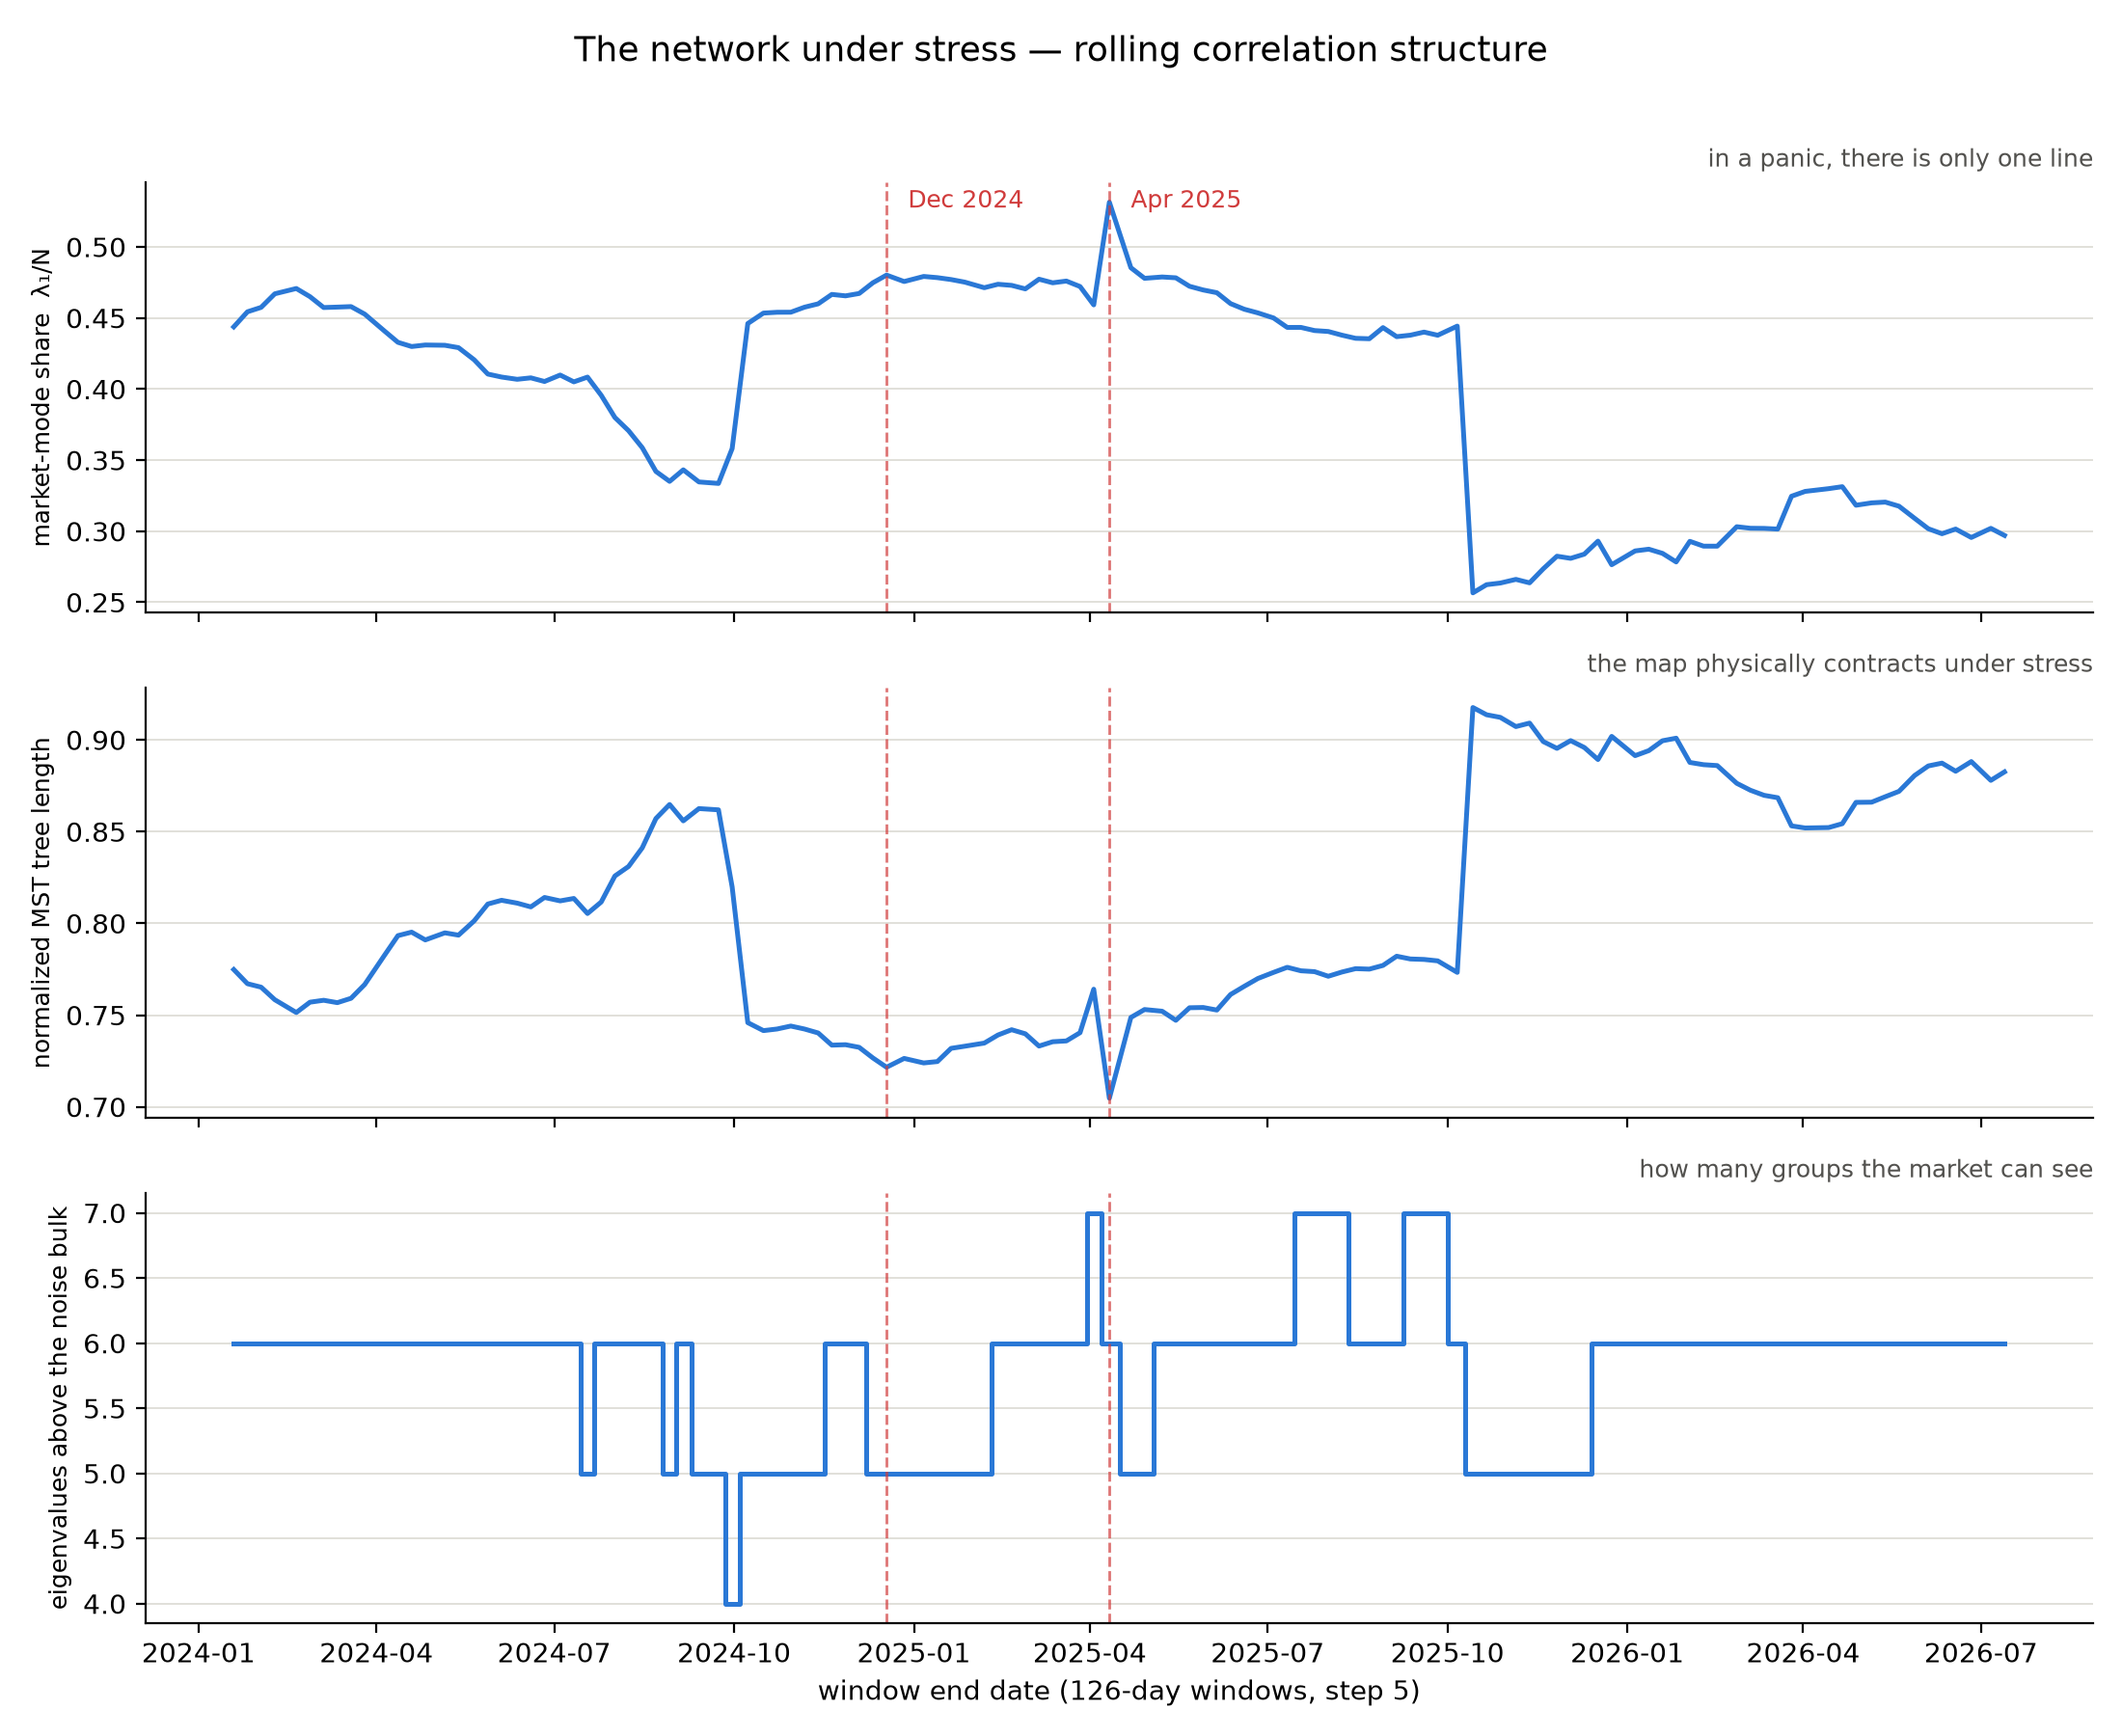
The groups are most visible in calm periods. During a shock, the market temporarily forgets their differences.
Rebuilding the network on rolling half-year windows shows it contracting sharply around the April 2025 tariff shock. The market mode rose to 54% of total variance and the tree reached its shortest length in the sample. Correlations also rise during broad rallies, but the message is clearest in stress: in a panic, there is only one trade.
Scope and limitations
Daily adjusted closes, July 2023–July 2026. The universe follows the June 2026 Hang Seng Index review; 89 of 93 constituents pass the history and missing-data checks.
Pearson and Kendall correlation; Marchenko–Pastur denoising; Mantegna distance; minimum spanning tree and PMFG; Ward clustering; permutation and moving-block-bootstrap inference.
Correlation is historical, window-dependent, and not causal. Portfolio returns are illustrative reconstructions, not investable indices. This project is educational and is not investment advice.
Laloux et al. (1999); Plerou et al. (2002); Mantegna (1999); Onnela et al. (2003); Tumminello et al. (2005). Full implementation details are documented in the project repository.